
IELTS Writing Task 1: How to Describe a Graph (Vocabulary + Band 7 Example)
In IELTS Academic Writing Task 1, you have about 20 minutes to describe a graph, chart, table or diagram in at least 150 words. Many candidates lose marks not because their English is weak, but because they describe every number, forget the overview, or repeat the same words again and again.
This guide shows you a simple four-part structure, the vocabulary you need to describe trends and comparisons, and a full Band 7 sample answer for a line graph. Use it as a template you can adapt to almost any Task 1 chart.
What the Examiner Is Looking For
Task 1 is marked on four criteria, each worth 25% of your score:
Task Achievement: Do you give a clear overview and select the most important features?
Coherence and Cohesion: Is your answer logically organised with clear paragraphs and linking words?
Lexical Resource: Do you use a range of accurate vocabulary for trends and numbers?
Grammatical Range and Accuracy: Do you mix simple and complex sentences with few errors?
Notice that "describe every detail" is not on the list. Selecting the key features is a skill the examiner rewards.
The 4-Part Structure
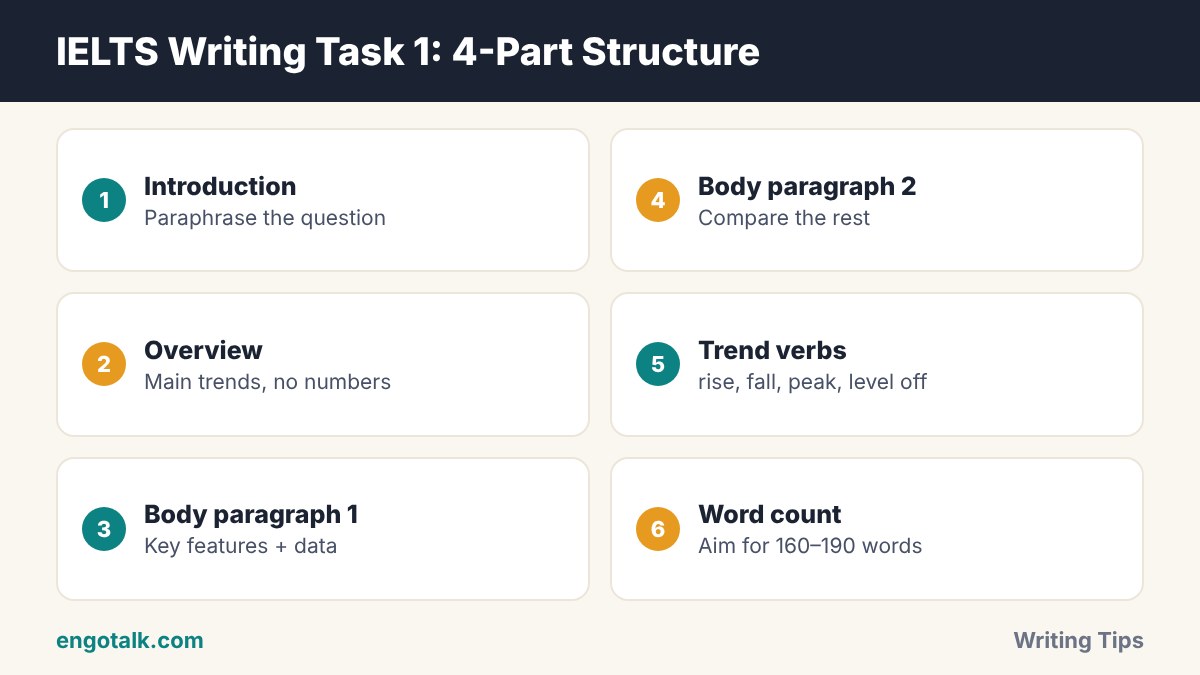
1. Introduction (1–2 sentences)
Paraphrase the question. Change the words, but keep the meaning. For example, "The graph shows the number of tourists" can become "The line graph illustrates how many tourists visited…".
2. Overview (2 sentences)
Describe the main trends or the biggest differences without numbers. This is the most important paragraph. Answers without a clear overview usually cannot score above Band 5 for Task Achievement.
3. Body paragraph 1
Describe the first group of key features with supporting numbers, for example the categories that increased.
4. Body paragraph 2
Describe the second group, for example the categories that fell or stayed stable, and make comparisons.
Tip: You do not need a conclusion in Task 1. Your overview does that job.
Vocabulary for Describing Trends
Going up
Verbs: rise, increase, grow, climb, soar (very fast), rocket (very fast)
Nouns: a rise, an increase, growth, a surge
Going down
Verbs: fall, decrease, decline, drop, plunge (very fast), plummet (very fast)
Nouns: a fall, a decrease, a decline, a drop
Staying the same or changing direction
Stable: remain stable, level off, plateau, stay constant
Changing: fluctuate, peak at, reach a high of, hit a low of, bottom out
Describing the size and speed of a change
Big: dramatically, sharply, significantly, considerably
Small: slightly, marginally, gradually, steadily
You can use two patterns and switch between them for variety:
Verb + adverb: Sales rose sharply in 2020.
Adjective + noun: There was a sharp rise in sales in 2020.
Language for Comparing and Giving Numbers
Comparisons: higher than, twice as many as, the largest proportion, by far the most popular, compared with
Approximations: just over, just under, roughly, approximately, nearly, around
Fractions: 25% = a quarter, 50% = half, 33% = a third, 75% = three quarters
Time phrases: over the period, between 2010 and 2020, by the end of the period, in the following decade
Band 7 Sample Answer: Line Graph
Task: The graph below shows the number of visitors (in millions) to three museums in a city between 2000 and 2020. Summarise the information by selecting and reporting the main features, and make comparisons where relevant.
(Data: the Science Museum rose from 2 to 6 million; the Art Gallery fell from 5 to 3 million; the History Museum stayed at about 4 million, with a peak of 5 million in 2010.)
The line graph compares the number of people who visited three museums in a city over a twenty-year period, from 2000 to 2020.
Overall, the Science Museum saw a dramatic increase in visitors and became the most popular attraction by the end of the period. In contrast, the Art Gallery experienced a steady decline, while visitor numbers at the History Museum remained relatively stable.
In 2000, the Science Museum attracted just 2 million visitors, the lowest figure of the three. However, this number climbed steadily over the next two decades and tripled to 6 million by 2020. The History Museum began the period at around 4 million visitors and peaked at 5 million in 2010, before returning to its original level.
The Art Gallery, on the other hand, was the most visited museum in 2000, with 5 million visitors. Its popularity then declined gradually, and by 2020 it welcomed only 3 million people, half the number recorded by the Science Museum in the same year.
This answer has about 170 words. Notice how it groups the information, uses a range of trend vocabulary, and does not try to mention every year.
Common Mistakes in Task 1
No overview. Always include a short paragraph with the main trends.
Copying the question. Paraphrase it instead, or the copied words will not count.
Giving opinions or reasons. Task 1 is a report. Do not explain why something happened.
Listing every number. Select the highest, lowest and most important changes.
Wrong tenses. Use the past simple for past dates, and the future or "is expected to" for projections.
Writing too much. Aim for 160–190 words so you have time for Task 2.
How to Practise
Collect five charts from news websites or past papers.
Write only the overview for each one in five minutes. This trains the most important skill.
Write one full answer under timed conditions (20 minutes) each week.
Check your vocabulary: did you use at least four different trend verbs?
When you are ready for the essay, read our guide to IELTS Writing Task 2 structure. To estimate your overall band, try the free IELTS band score calculator.
Improve Your Speaking Score Too
Writing can be practised alone, but speaking cannot. On EngoTalk, you can practise IELTS-style questions on a live 1-on-1 video call with learners and tutors. Start a practice call and get comfortable talking about data, trends and opinions.
Frequently Asked Questions
How many words should I write in IELTS Writing Task 1?
At least 150 words. Most strong answers are between 160 and 190 words. Writing much more wastes time you need for Task 2.
Do I need a conclusion in Task 1?
No. A clear overview of the main trends is more important. You can place the overview after the introduction or at the end.
Should I mention every number in the graph?
No. Select the key features, such as the highest and lowest values and the biggest changes, and support them with data.
How long should I spend on Task 1?
About 20 minutes. Task 2 is worth twice as many marks, so give it around 40 minutes.
Test yourself: 5-question quiz
Check what you remember from this article. It takes about one minute, and you earn XP for completing it.